L4S development hub
Overload results caused by non-responsive UDP traffic for PIE, DualPI2 and CoDel AQMs
This page explains the comparison results when testing the behavior of PIE, DualPI2 and CoDel when combined with non-responsive UDP traffic with and without ECN. In short, the results show no significant benefits for PIE/PI2 nor for DualPI2, but problematic behavior for CoDel and FQ_CoDel.
Background
The performed experiments mainly evaluate the potential benefits for an attacker to label its traffic as ECN Capable Traffic (ECT) and especially strong concerns have been expressed for labeling traffic ECT(1) in combination with a DualPI2 AQM. Thought experiments have been defined to exploit the priority (or high weight RR) scheduler using ECN.
Conclusion
The results show that labeling ECT(1) gives no benefits at all on a PIE, DualPI2 and PI2 AQM due to adequate overload measures. On the other hand, labeling ECT(0 or 1) on a CoDel (or FQ-CoDel) AQM give a large advantage for the ECT traffic: it will get only dropped due to tail-drop if the queue is full, while not-ECT traffic will get starved. As discussed in the past, the CoDel and FQ-CoDel AQMs completely lack overload protection mechanisms (neither for ECN capable traffic nor for non-responding traffic in general). When supporting ECN, it shows the importance of having a point when ECT packets should also be dropped.
Details (how it works)
Below you can see the results of experiments for 3 AQMs (PIE, DualPI2 and CoDel (= FQ_CoDel flows 1)), using 2 types of UDP traffic (ECT and not-ECT) with 5 levels of load or overload (from 50Mbps to 200Mbps, resp. 50% to 200% of the link capacity). As “innocent bystander” test traffic we always send 5 not-ECT responsive flows and 5 ECT responsive flows (Classic for PIE and CoDel and L4S for DualPI2). The link capacity is 100Mbps and the base RTT is 10ms for all traffic. The AQMs are the Linux implementations with default parameters, except for CoDel which is actually FQ_CoDel configured as CoDel (with “flows 1” parameter).
In figure 1 below, we see that the results are very similar both for PIE and DualPI2 AQMs, and ECT(x) and not-ECT UDP flows. There is no significant benefit whether the non-responsive UDP flow marks ECT or not-ECT as both PIE and (Dual)PI2 start dropping ECT packets when the PIE and PI2 probability exceeds an ECN-drop threshold of respectively 10% and 25%.
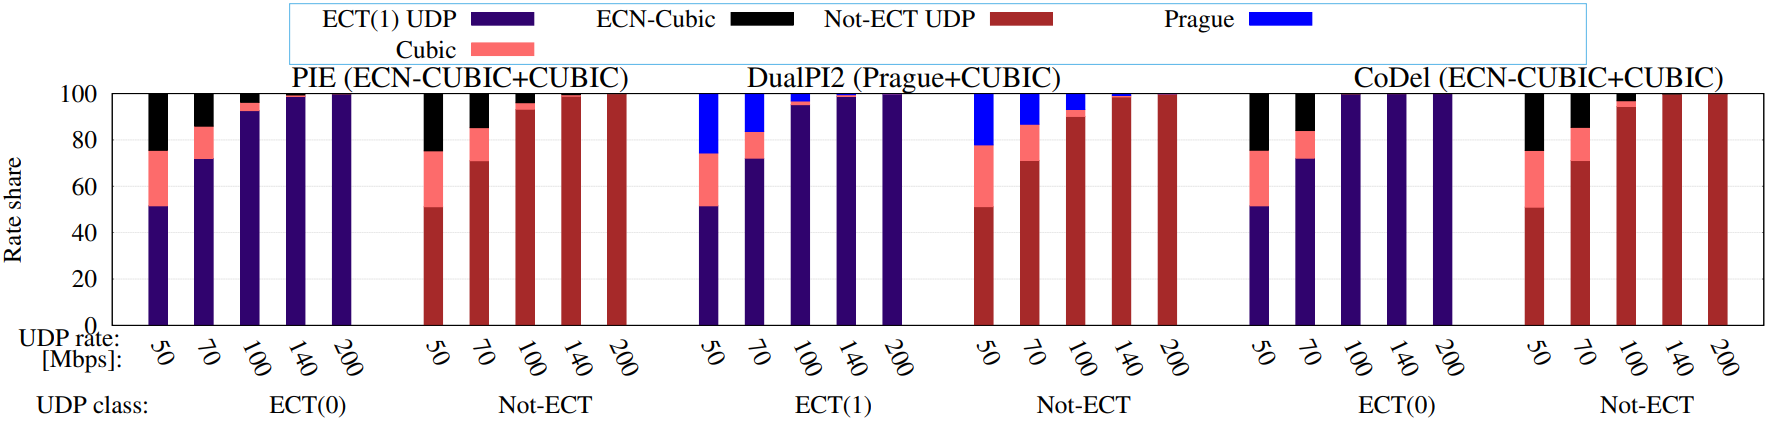 Figure 1: Rate share for 5 flows of each ECT and not-ECT type of traffic with one type of unresponsive UDP traffic (not-ECT or ECT(0/1)
CoDel does not have this ECN-drop threshold mechanism (although recommended in RFC7567), with uncontrolled ECN throughput and latency as a result, as shown in figure 1 and figure 2 in more detail (ECT-UDP using more than 99.9% of the capacity for even light overload around the link capacity).
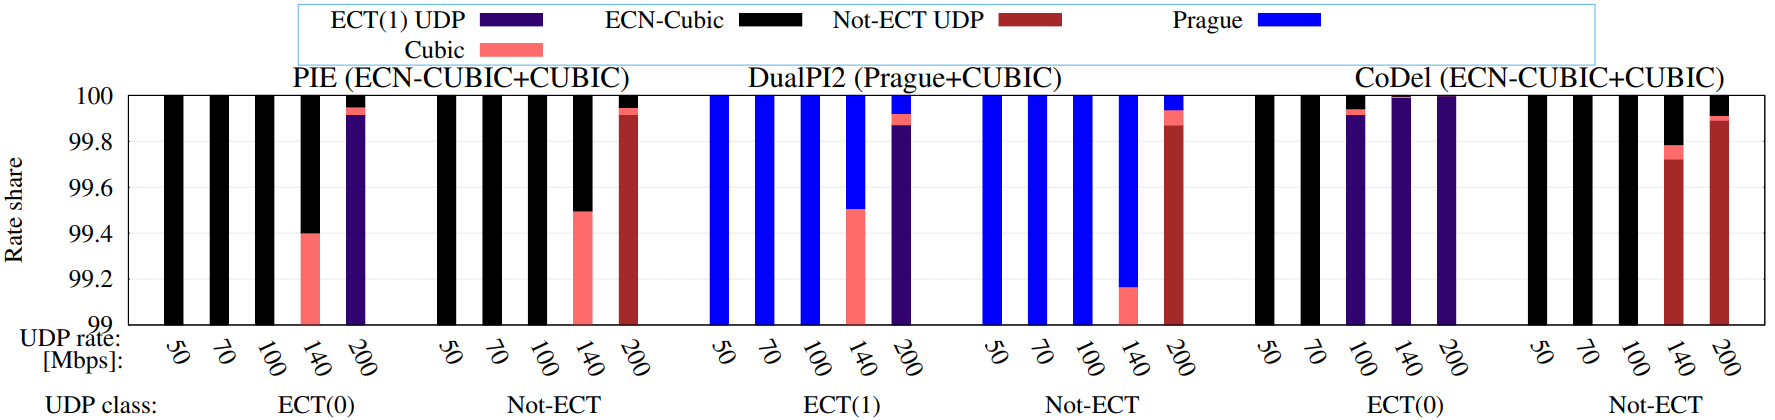 Figure 2: Same as figure 1, but zoomed in on 99-100%
Figure 3 belowshows that the CoDel queue is overflowing for the ECT unresponsive traffic (default queue limit is 10240 packets in FQ_CoDel) and even for not-ECT traffic when the overload gets higher.
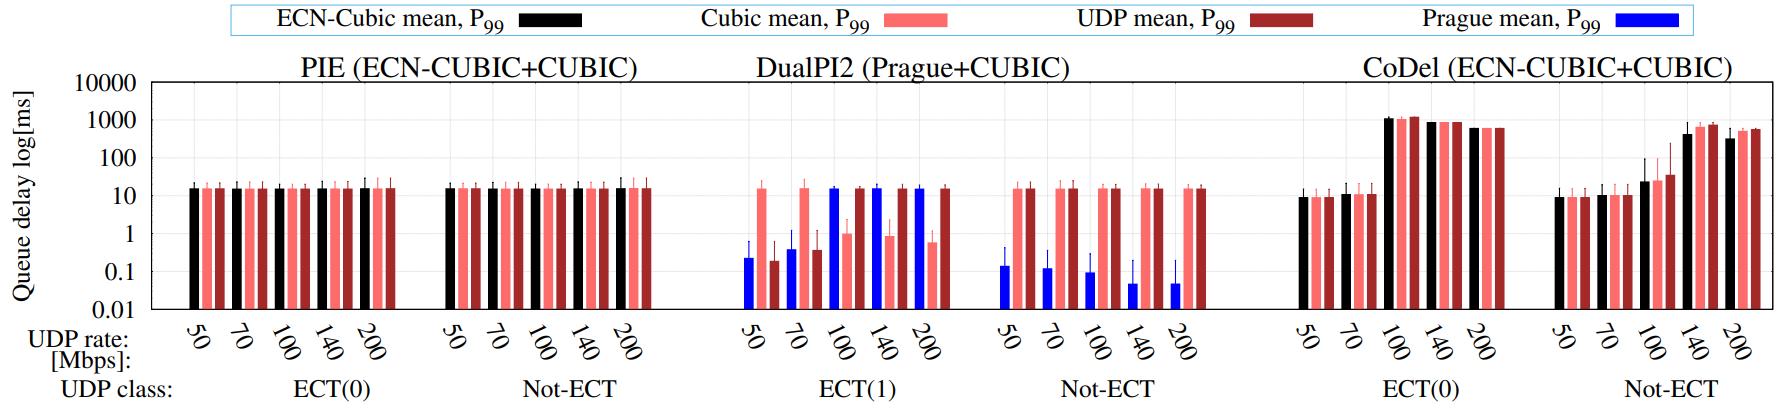 Figure 3: Queue delays for the same experiments as in figure 1
Nitty details (how all pieces fall into place)
When looking at figure 3 we see how DualPI2 makes sure that L4S marked non-responsive flows even don’t get a latency bonus under overload (sending >95% of the link capacity). When the L4S queue cannot be controlled by marking, it will grow bigger than the Classic queue, where its size is picked-up by the Classic PI AQM that uses the max queue delay of both queues as input to control. This allows to remove the ECT incentive for unresponsive traffic completely, as both the same drop and delay is experienced independently from which queue it gets scheduled. The dual queue coupling gets reversed in that case, making the L4S queue delay the input of the PI controller, and the dropping is applied to both queues. Also note that the Classic queue will get empty in that case.
Only when non-responsive traffic is below the link capacity it can fully use that share, making the responsive flows share the rest of the capacity (as usual for any AQM on the Internet on a shared queue).
The inability of CoDel to control overload traffic is striking when looking at the CoDel delay results in figure 3.
Figure 4 shows that the queue is continuously in tail-drop mode for ECT-UDP traffic.
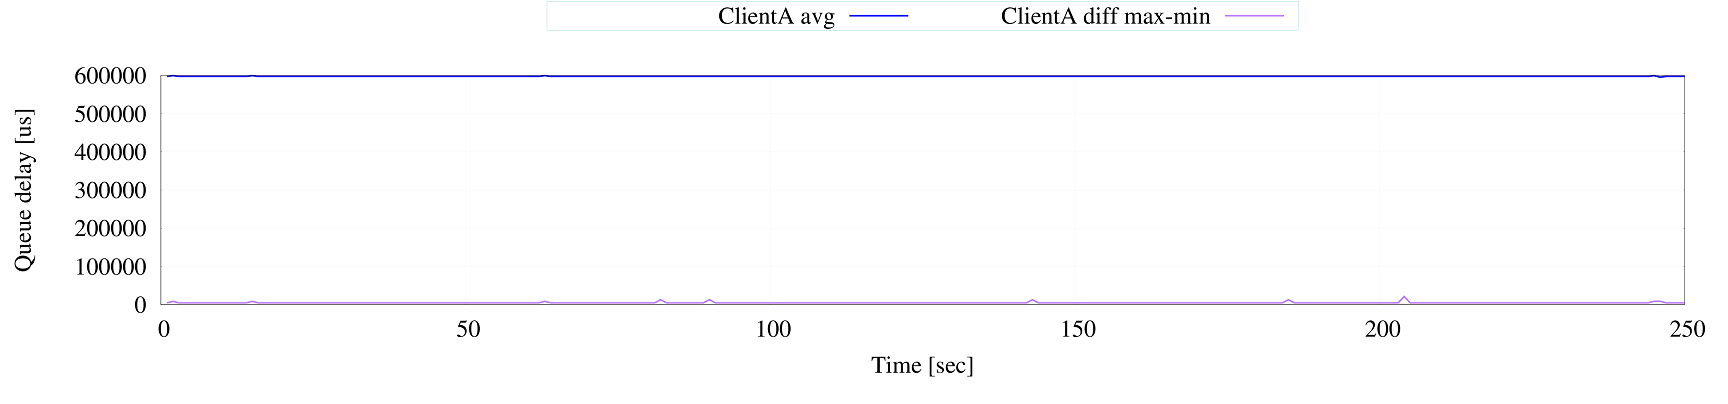 Figure 4: When unresponsive ECT(0) traffic higher than the bottleneck rate is send in a CoDel AQM the queue overflows at tail-drop
Figure 5 shows that the CoDel algorithm is in a 100 second cycle for the 200% overload case where CoDel is decrementing the one-packet-drop timer from initially 100ms down to the required rate to drain the queue below the 5 ms target, where it resets itself to start over dropping one packet per 100ms.
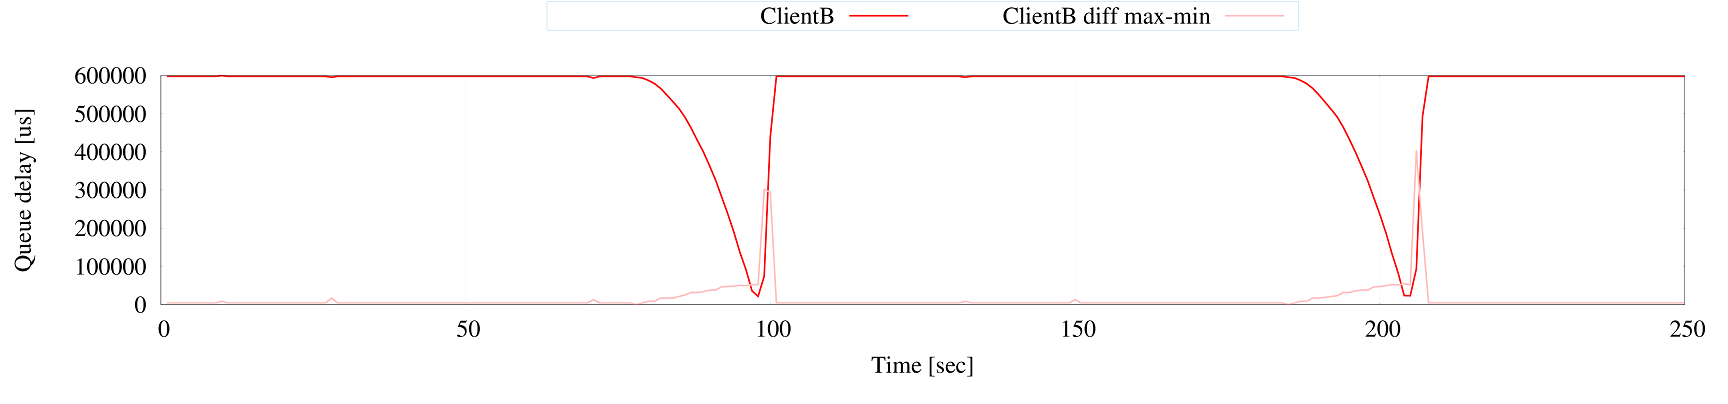 Figure 5: When 200Mbps unresponsive not-ECT traffic is send in a CoDel AQM of a 100Mbps bottleneck, an appropriate drop probability (>50%) is reached only after 100 seconds and then immediately forgotten, causing most of the time tail-drop
Both PIE and (Dual)PI2 start dropping ECT packets when the PIE and PI2 probability exceeds an ECN-drop threshold of respectively 10% and 25%. Hence, an overload situation occurs continuously when the UDP traffic is not-ECT or is ECT(x) and its rate is above 110% for PIE and 125% for PI2 of the link capacity. ECT-UDP rates below those rates will get only marked and cause queue growth until the PI reaches the ECN-drop threshold, then more drop is applied than the excess rate until the egress rate drops below the link capacity and the queue drains, making the PIE/PI2 probability go below the ECN-drop threshold, causing the queue to grow again.
Figure 6 (not-ECT UDP) and 7 (L4S UDP) show the average queue delay the for DualPI2 AQM for the 100Mbps unresponsive UDP load. Here the output of the PI2 AQM will vary around the ECN-drop threshold. The plot shows the average of one second intervals and in the lighter color the difference between the highest and lowest packet delay measured in the queue during that second. The queue delay is in both cases nicely around the target. The maximum variations not exceeding their average, proving full link utilization (even when alternating around the ECN-drop threshold).
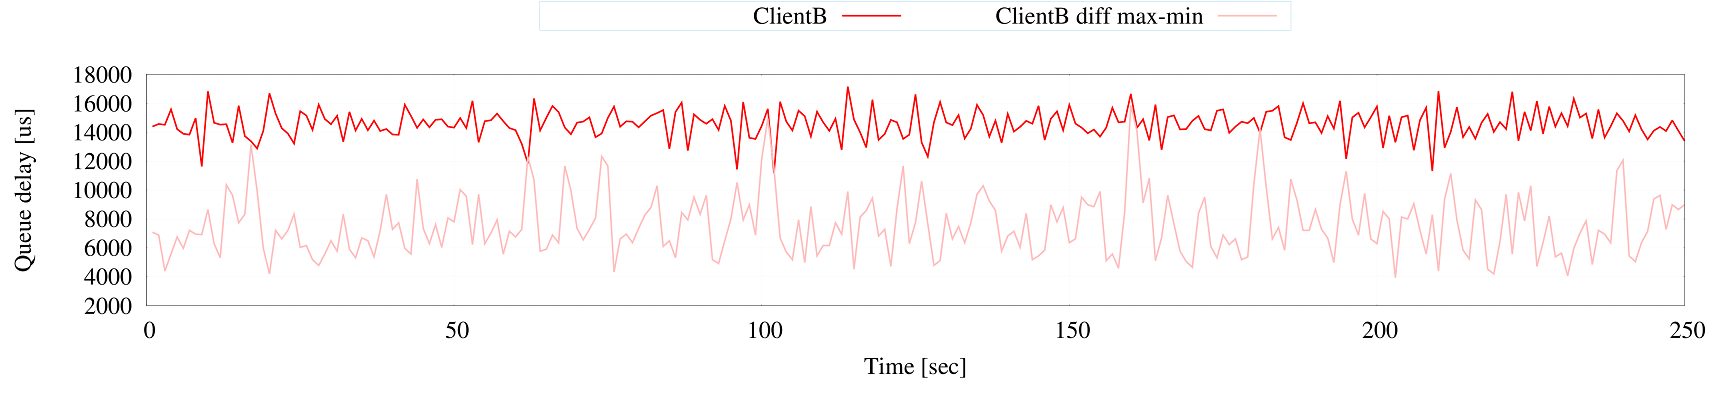 Figure 6: Queue delay over time plot shows stable 15ms target delay for PI2 when a not-ECT Classic unresponsive UDP flow is over the link capacity, as a reference to compare with figures 5, 6 and 7
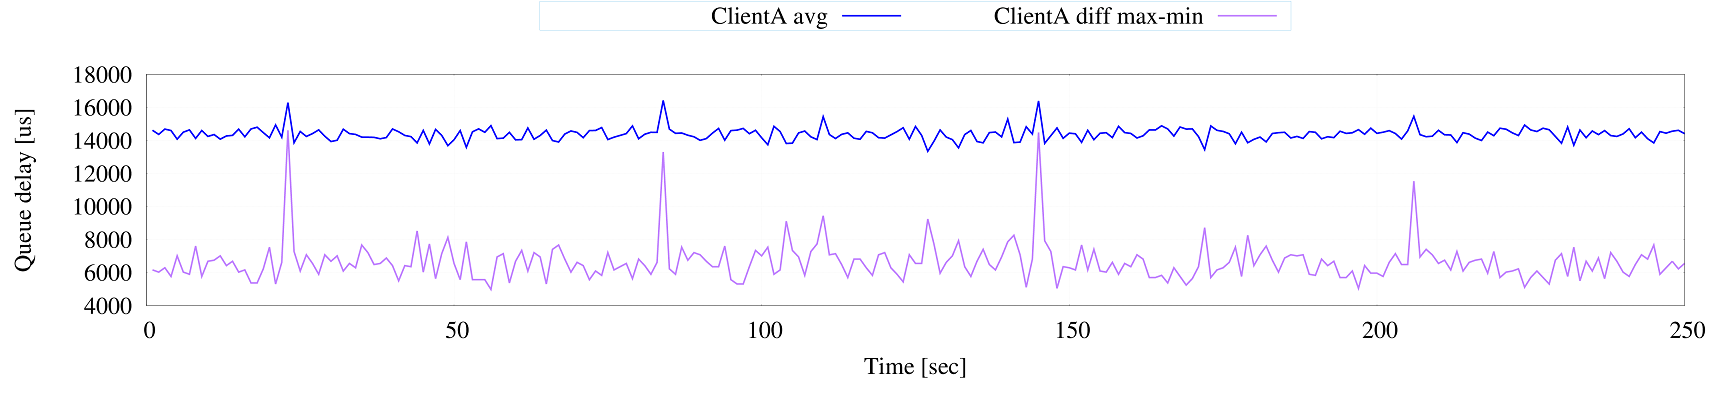 Figure 7: Queue delay over time plot shows stable 15ms target delay for PI2 when an ECT(1) L4S labeled unresponsive UDP flow is slightly over the link capacity, causing the ECN-drop threshold to switch on and off
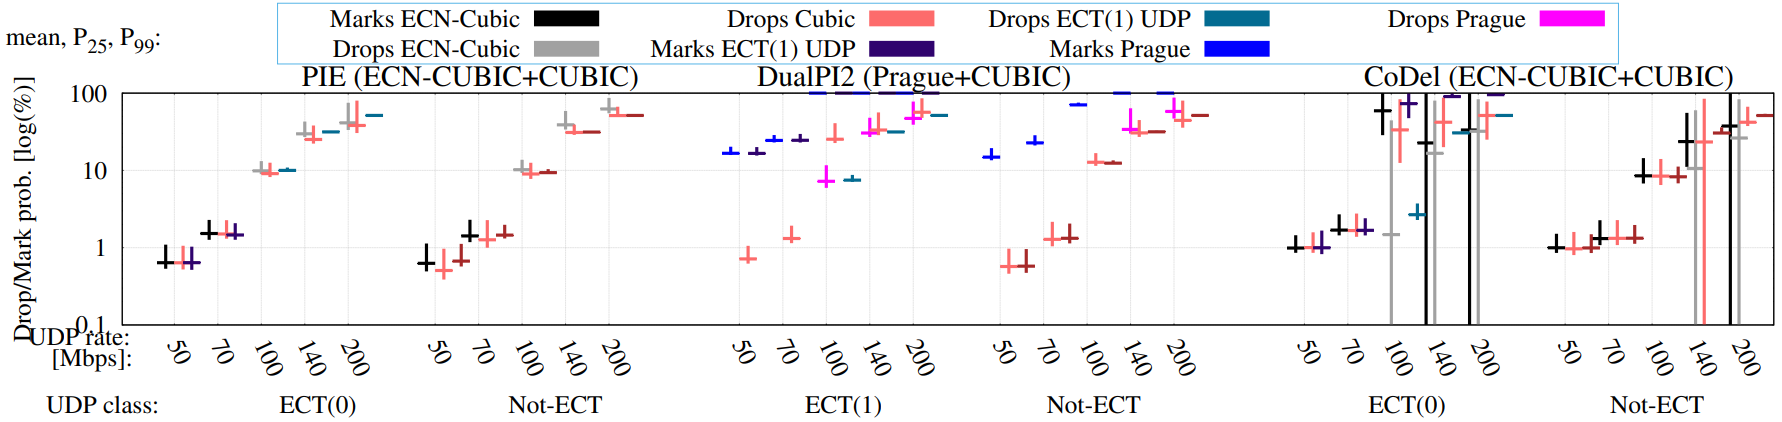 Figure 8: Shows the drop probabilities. When analyzed in detail, it confirms the above explanations.